Sonja Vandeleur discusses the need for thinking skills in South African education to address inequality and improve learning outcomes.
The Education Challenge
•South Africa is the most unequal country in the world, with education quality a key issue.•78% of grade 4 learners cannot read for meaning.•Classes are large (30-60 pupils), and students often share books; they are taught to read correctly but not for understanding.•The focus needs to shift to resources for teaching and learning, including in-service teacher training.Thinking Skills Interventions
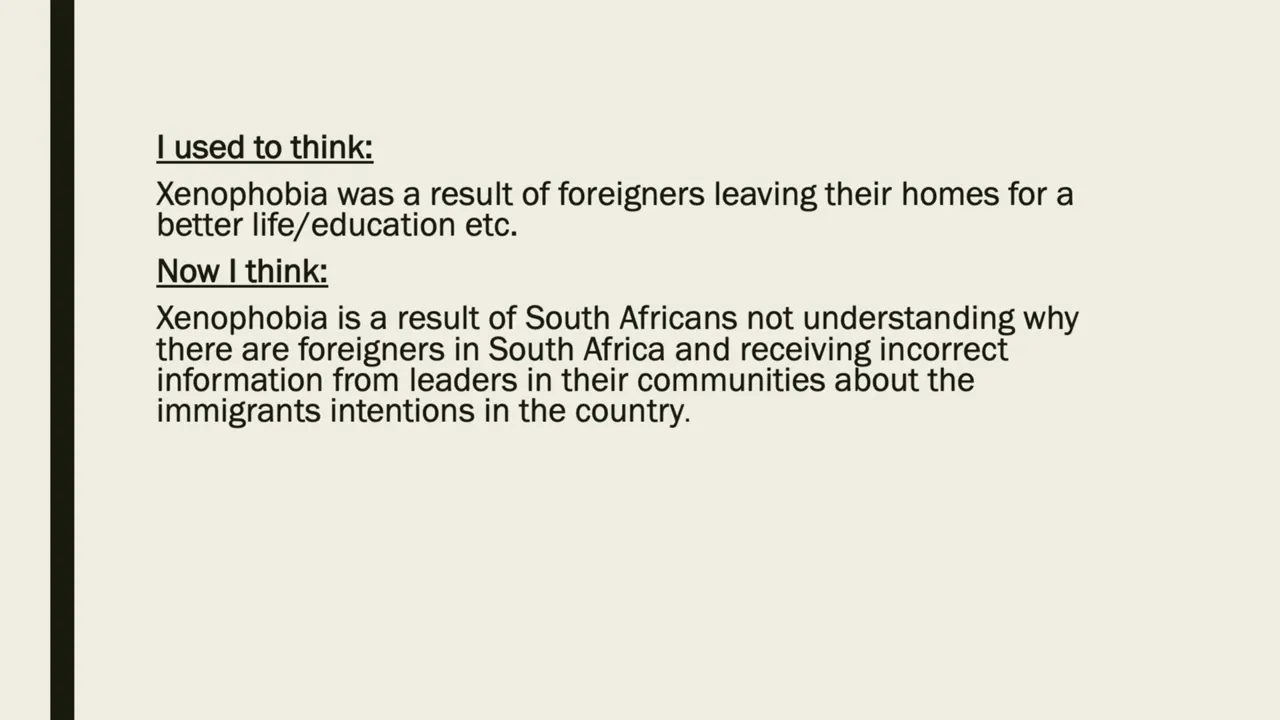
•At Belleville primary, Elmarie Peterson used thinking maps (8 maps based on 8 cognitive processes) to help learners organize and make thinking visible.•Results: Home language pass rates rose from just over 50% in 2013 to over 70% in 2015.•At Vandeleur's school, they use 16 habits of mind (e.g., listening with understanding and empathy) and de Bono's thinking hats.•A grade 8 unit on xenophobia used the hats to structure discussions, shifting students' views from limited understanding to more nuanced perspectives.Key Takeaways
•South Africa faces extreme educational inequality with poor reading comprehension among primary learners.•Thinking skills like thinking maps and habits of mind can significantly improve academic results.•Explicit teaching of thinking strategies enables students to engage with complex social issues and develop higher-order thinking.Conclusion
Education is the most important form of social investment we can make.
 2:58
2:58 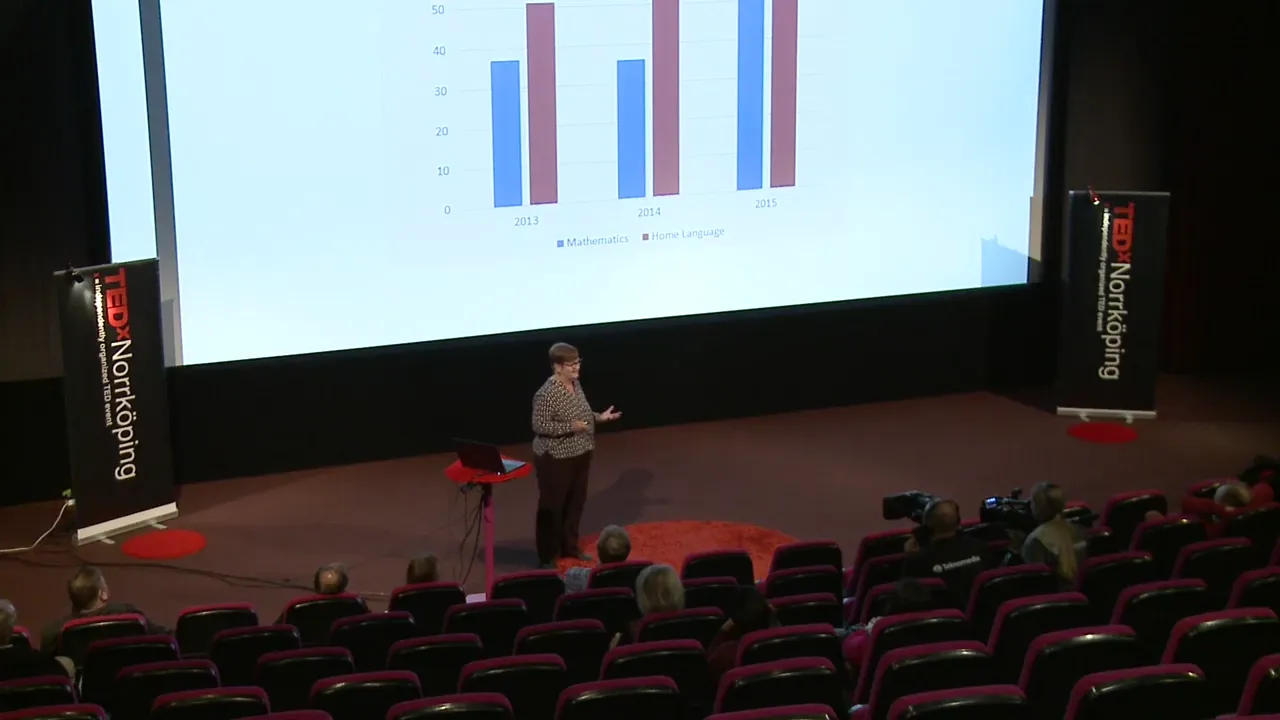 10:09
10:09