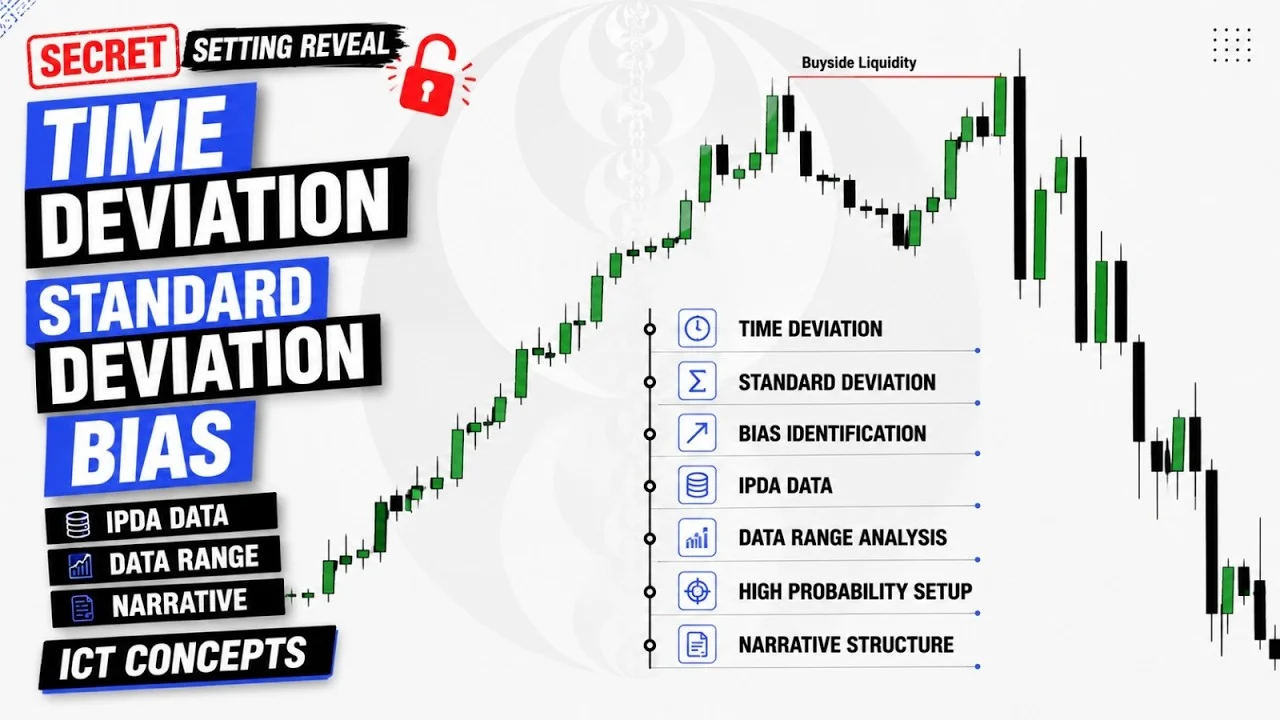
This video explains the practical use of standard deviation in trading, how to identify IBD data ranges, and provides rules for trade setups based on price behavior.
Introduction to Advanced Market Concepts ⏱ 0:07
•Host Haseeb welcomes viewers to his YouTube channel, promising to discuss topics unknown to 99% of traders, including ICT concepts.•States this video will make viewers more knowledgeable than typical ICT traders, changing their perspective on reading charts and making predictions.•Outlines topics to be covered: Standard Deviation, advanced OHLC, IPDA data ranges, biases, narratives, frameworks, and a special liquidity concept called time-based liquidity.•Claims these concepts, when mastered, can help predict market moves, execute trades, and have an edge.•Urges viewers to watch the full video, calling it a game-changer.Understanding Standard Deviation and Time Alignment ⏱ 3:42
•Standard Deviation is a tool to measure where a price move may end, not for trading directly on the levels (e.g., -1, -1.5, -2) as commonly taught; those levels are only for targets.•He introduces his own custom Standard Deviation settings, which he claims are unique and should be copied exactly with specific colors and levels; calls it "X Black Line."•Standard Deviation should be plotted on a "leg" (an MSS point), and there are two types: IPO manipulation leg and distribution leg.•Emphasizes time alignment: for a monthly candle, use daily and 4-hour structure for legs; for weekly, use 4-hour and 1-hour; for daily, use 1-hour, 30-min, and 15-min; for 4-hour, use 5-min and 3-min.•Key levels to focus on are -0.5 and -0.618, and if price closes below the zone, the high becomes a strong low and price may target -2, -2.5, -4, -4.5 levels with 70-80% probability.Price Behavior and Trade Setups ⏱ 20:07
•Price often does not reach extreme POI; instead it hunts the BSL and drops, or creates a zone and falls.•If price gives a body close below the first zone, the high is confirmed and price may drop from the first line of defense (FLOD) rather than giving a deep retracement.•Price reaches the extreme POI only when it breaks with speed after a body close, leading to a sharp move to -2 and -2.5 zones.•In stage 2, if price goes sideways at a zone, a line is drawn and price can either go to -4 or retrace to highs depending on body closes.Three Stages of Price Movement and Trading Rules ⏱ 29:24
•Stage 1: If price gives a body close below a zone, the high is confirmed and reversal trades can be taken.•Stage 2: If price goes sideways, a line is drawn; a fake move takes out stop losses, then price goes to extreme POI and gives a sell.•Stage 3: If price gives a body close below -0.75, expect no deep retracement and price drops to -4 and -4.5.•Trade targets are set at the next zones; if price gives a body close above a zone, the high may be taken out, else price drops.Introduction to IBD Data Ranges ⏱ 34:04
•IBD data ranges are a powerful concept to predict market reversals, liquidity hunts, and price direction.•IBD data ranges are a lookback period: for any candle's PO3, you need the previous three candles' data.•Examples: For a weekly candle, use data from previous 3 weeks; for a daily candle, use previous 3 days; for a 4-hour candle, use previous three 4-hour candles.•This concept helps in understanding where institutions may buy or sell and which liquidity to target.Key Concepts and Applications ⏱ 40:07
•The IDDA manipulation leg is marked from the highest of three candles and used with standard deviation settings to find reversals, buy-side bias, and narrative.•Time alignments: Use daily structure for monthly candles, 4H and 1H for weekly PO3, 1H/3min/15min for daily, and 5min/3min for 4H.•Distribution leg: Mark the first leg after a buy move; when price closes above its zone, reversal is confirmed. Price moves in three stages to targets; the main trade is capturing the move from below.•Time-based liquidity: In IDDA data ranges (3-2-1), price typically hunts external liquidity then internal. If external not taken within the next three candles (e.g., 4H or weekly), price likely returns to external again, signaling trend continuation, not reversal.Trading Methodology and Application ⏱ 60:07
•The speaker demonstrates how to identify the main standard deviation leg (main leg) from candles labeled 1, 2, 3; candle 2 is the main leg.•IDA manipulation leg is marked using the standard deviation settings, and weekly candles are used for data, with hourly charts for precision.•Key points: liquidity sweep points, extreme POI, order flow, and target zones like -2 to -2.5 and -4.75; examples include a trade placed at -4.75, targets at -2 and -2.5, and a 50% area retracement.•The speaker explains how to read price action, body closures, and rejections to confirm trades, and mentions using time deviation and standard deviation for entry confirmations.Key Trading Concepts and Live Market Application ⏱ 80:08
•Price body closing below a zone signals reversal; retest and rejection from higher timeframe zones lead to aggressive moves and easy targets.•Stage 2 on higher timeframe completes, while lower timeframe completes Stage 3; price may consolidate before reaching targets.•Marking IPDA ranges and legs: use three weeks of data, identify manipulation legs, and note body closes below zones for entries.•Live application: price moved aggressively after body close, tapped order block, and fell; potential free fall to -2/-2.5 zones; backtesting without cuts shows predicted moves (e.g., price to 82).Key Takeaways
•Standard deviation measures where a price move may end, but the levels like -1, -1.5, -2 should not be traded directly.•Price often hunts the buy-side liquidity (BSL) and drops, or creates a zone and falls, rather than reaching the extreme point of interest (POI).•If price gives a body close below the first zone, the high is confirmed and reversal trades can be taken.•Stage 1: body close below a zone triggers reversal trade; Stage 2: if price goes sideways, draw a line and wait for a close below or above.•IBD data ranges are a lookback period that predicts market reversals, liquidity hunts, and price direction.•The main standard deviation leg is identified from candles labeled 1, 2, 3, with candle 2 being the main leg, and it is used with standard deviation settings to find reversals and biases.Conclusion
The video covers the application of standard deviation and IBD data ranges within ICT concepts, providing specific rules for identifying trade setups and market direction.